> ## Documentation Index
> Fetch the complete documentation index at: https://docs.rallied.ai/llms.txt
> Use this file to discover all available pages before exploring further.
# Performance
> See what the agent is really doing for your MSP: how often it works tickets, gets things done in your systems, and finishes with no technician involved.
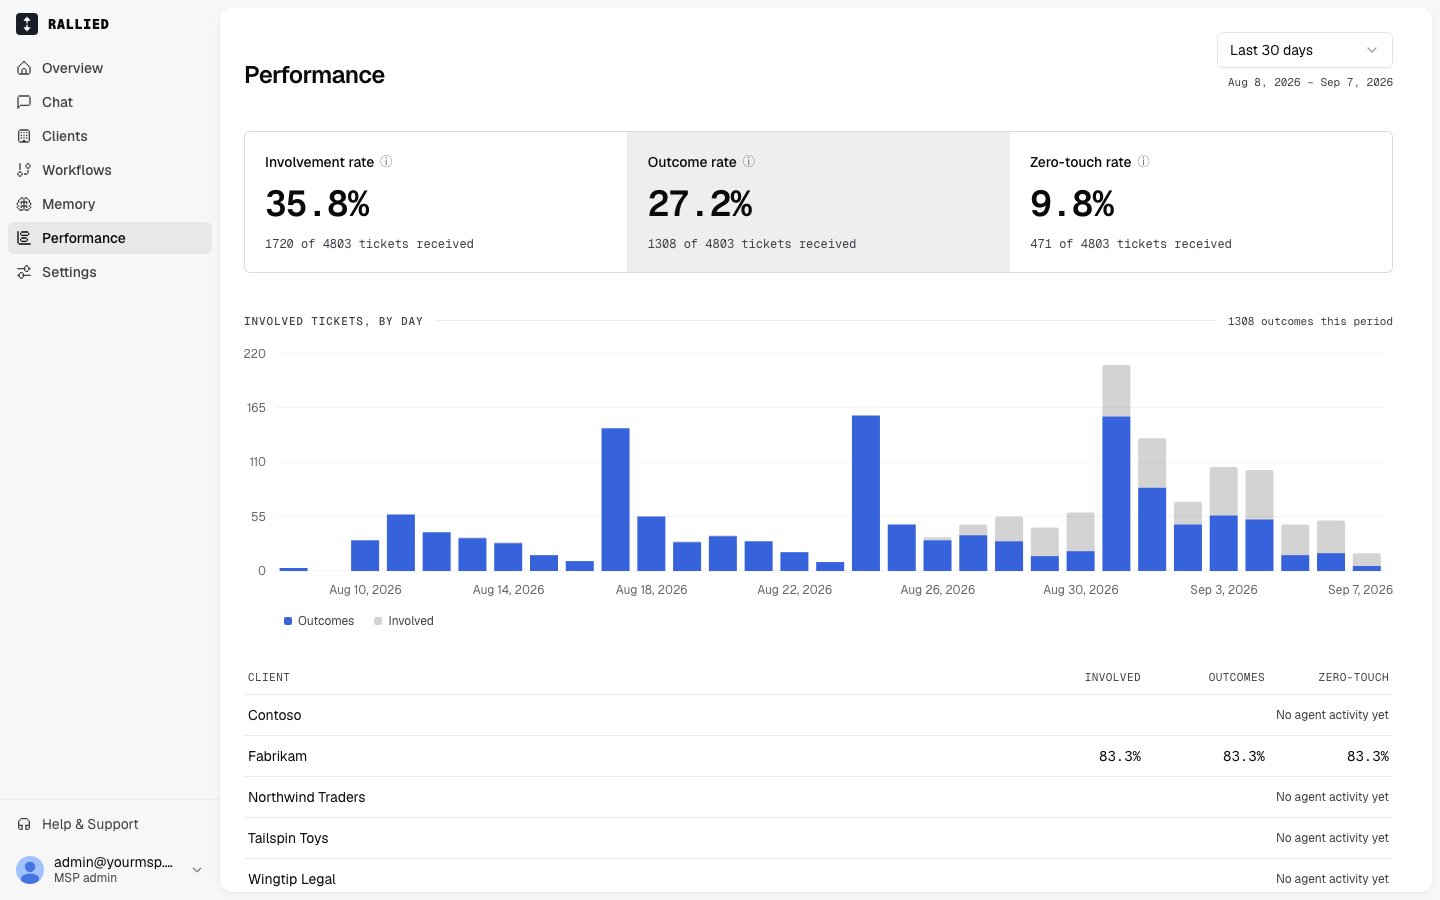
The Performance page is your MSP-wide scoreboard for the agent. It tracks three rates over a rolling 7-, 30-, or 90-day window: **involvement** (how often the agent touched a ticket), **outcome** (how often it changed something in your systems), and **zero-touch** (how often it finished with no technician involved). Use it to see where the agent is pulling its weight, which clients are ready for more automation, and where Plan Mode is still holding things back.
## The three metrics
Open **Performance** in the sidebar. Pick a window: **Last 7 days**, **Last 30 days**, or **Last 90 days**.
Each card shows a percentage. It also shows the count behind it, as "N of M tickets received".
 | Metric | What it counts |
| -------------------- | --------------------------------------------------------------------------------------- |
| **Involvement rate** | Tickets the agent worked on. A plan, a note, or an action counts. |
| **Outcome rate** | Tickets where the agent changed something in your systems, or ran a workflow you wrote. |
| **Zero-touch rate** | Outcomes with no one from your team involved. |
All three rates use the same set of tickets: every ticket received in the window, minus tickets whose agent activity is not classified yet.
The metrics relate like this:
* Each zero-touch ticket is also an outcome.
* Each outcome is also an involved ticket.
* So involvement is the largest percentage, then outcome, then zero-touch.
Click a card to see the tickets behind it.
### Involvement
The agent did at least one successful thing on the ticket. A posted plan counts. An internal note counts.
### Outcome
The agent changed a system other than the ticket record. A password reset counts. An access grant counts. A workflow you wrote counts.
These do **not** count as an outcome:
* Notes
* Status changes
* Time entries
The ticket does not have to be closed.
### Zero-touch
The agent delivered an outcome. No person on your team touched the ticket after the agent's first change to your systems.
Work before that point does not stop the ticket from counting as zero-touch. Filing the ticket does not stop it. Assigning the ticket does not stop it.
## Reading the chart
**Involved tickets, by day** shows counts, not rates. Each bar is one day.
* The bottom segment is outcomes.
* The segment on top is tickets the agent touched with no outcome.
* The total on hover is every involved ticket that day.
## Per-client breakdown
If you have more than one client, a table below the chart shows **Client**, **Involved**, **Outcomes**, and **Zero-touch** as percentages for each client.
A client with no agent activity in the window shows **No agent activity yet**.
## Plan Mode and pending data
**Plan Mode.** In Plan Mode the agent diagnoses and posts a plan. It does not execute changes. Outcome rate and zero-touch rate come only from clients in Execute Mode. If no client is in Execute Mode, those two rates stay at zero. Involvement rate still counts the plans the agent posted. The page says this above the cards when it applies.
**Measuring since.** A card that shows **Measuring since** and a date is still collecting classified data. It does not show a zero until that data is ready.
## Related
* [Plan Mode](/agents/plan-mode) — why outcomes stay at zero until you switch a client.
* [Execute Mode](/agents/execute-mode) — the mode that produces outcomes and zero-touch resolutions.
* [Activity](/dashboard/activity) — the per-ticket log behind every count on this page.
* [Clients](/dashboard/clients) — switch a client's mode.
| Metric | What it counts |
| -------------------- | --------------------------------------------------------------------------------------- |
| **Involvement rate** | Tickets the agent worked on. A plan, a note, or an action counts. |
| **Outcome rate** | Tickets where the agent changed something in your systems, or ran a workflow you wrote. |
| **Zero-touch rate** | Outcomes with no one from your team involved. |
All three rates use the same set of tickets: every ticket received in the window, minus tickets whose agent activity is not classified yet.
The metrics relate like this:
* Each zero-touch ticket is also an outcome.
* Each outcome is also an involved ticket.
* So involvement is the largest percentage, then outcome, then zero-touch.
Click a card to see the tickets behind it.
### Involvement
The agent did at least one successful thing on the ticket. A posted plan counts. An internal note counts.
### Outcome
The agent changed a system other than the ticket record. A password reset counts. An access grant counts. A workflow you wrote counts.
These do **not** count as an outcome:
* Notes
* Status changes
* Time entries
The ticket does not have to be closed.
### Zero-touch
The agent delivered an outcome. No person on your team touched the ticket after the agent's first change to your systems.
Work before that point does not stop the ticket from counting as zero-touch. Filing the ticket does not stop it. Assigning the ticket does not stop it.
## Reading the chart
**Involved tickets, by day** shows counts, not rates. Each bar is one day.
* The bottom segment is outcomes.
* The segment on top is tickets the agent touched with no outcome.
* The total on hover is every involved ticket that day.
## Per-client breakdown
If you have more than one client, a table below the chart shows **Client**, **Involved**, **Outcomes**, and **Zero-touch** as percentages for each client.
A client with no agent activity in the window shows **No agent activity yet**.
## Plan Mode and pending data
**Plan Mode.** In Plan Mode the agent diagnoses and posts a plan. It does not execute changes. Outcome rate and zero-touch rate come only from clients in Execute Mode. If no client is in Execute Mode, those two rates stay at zero. Involvement rate still counts the plans the agent posted. The page says this above the cards when it applies.
**Measuring since.** A card that shows **Measuring since** and a date is still collecting classified data. It does not show a zero until that data is ready.
## Related
* [Plan Mode](/agents/plan-mode) — why outcomes stay at zero until you switch a client.
* [Execute Mode](/agents/execute-mode) — the mode that produces outcomes and zero-touch resolutions.
* [Activity](/dashboard/activity) — the per-ticket log behind every count on this page.
* [Clients](/dashboard/clients) — switch a client's mode.